Sample property · Cape Coral, FL
Pitch breakdown
Shingle area (2/12 and steeper): 3,476 sq ft · Low-slope area (under 2/12, membrane roofing): 0 sq ft
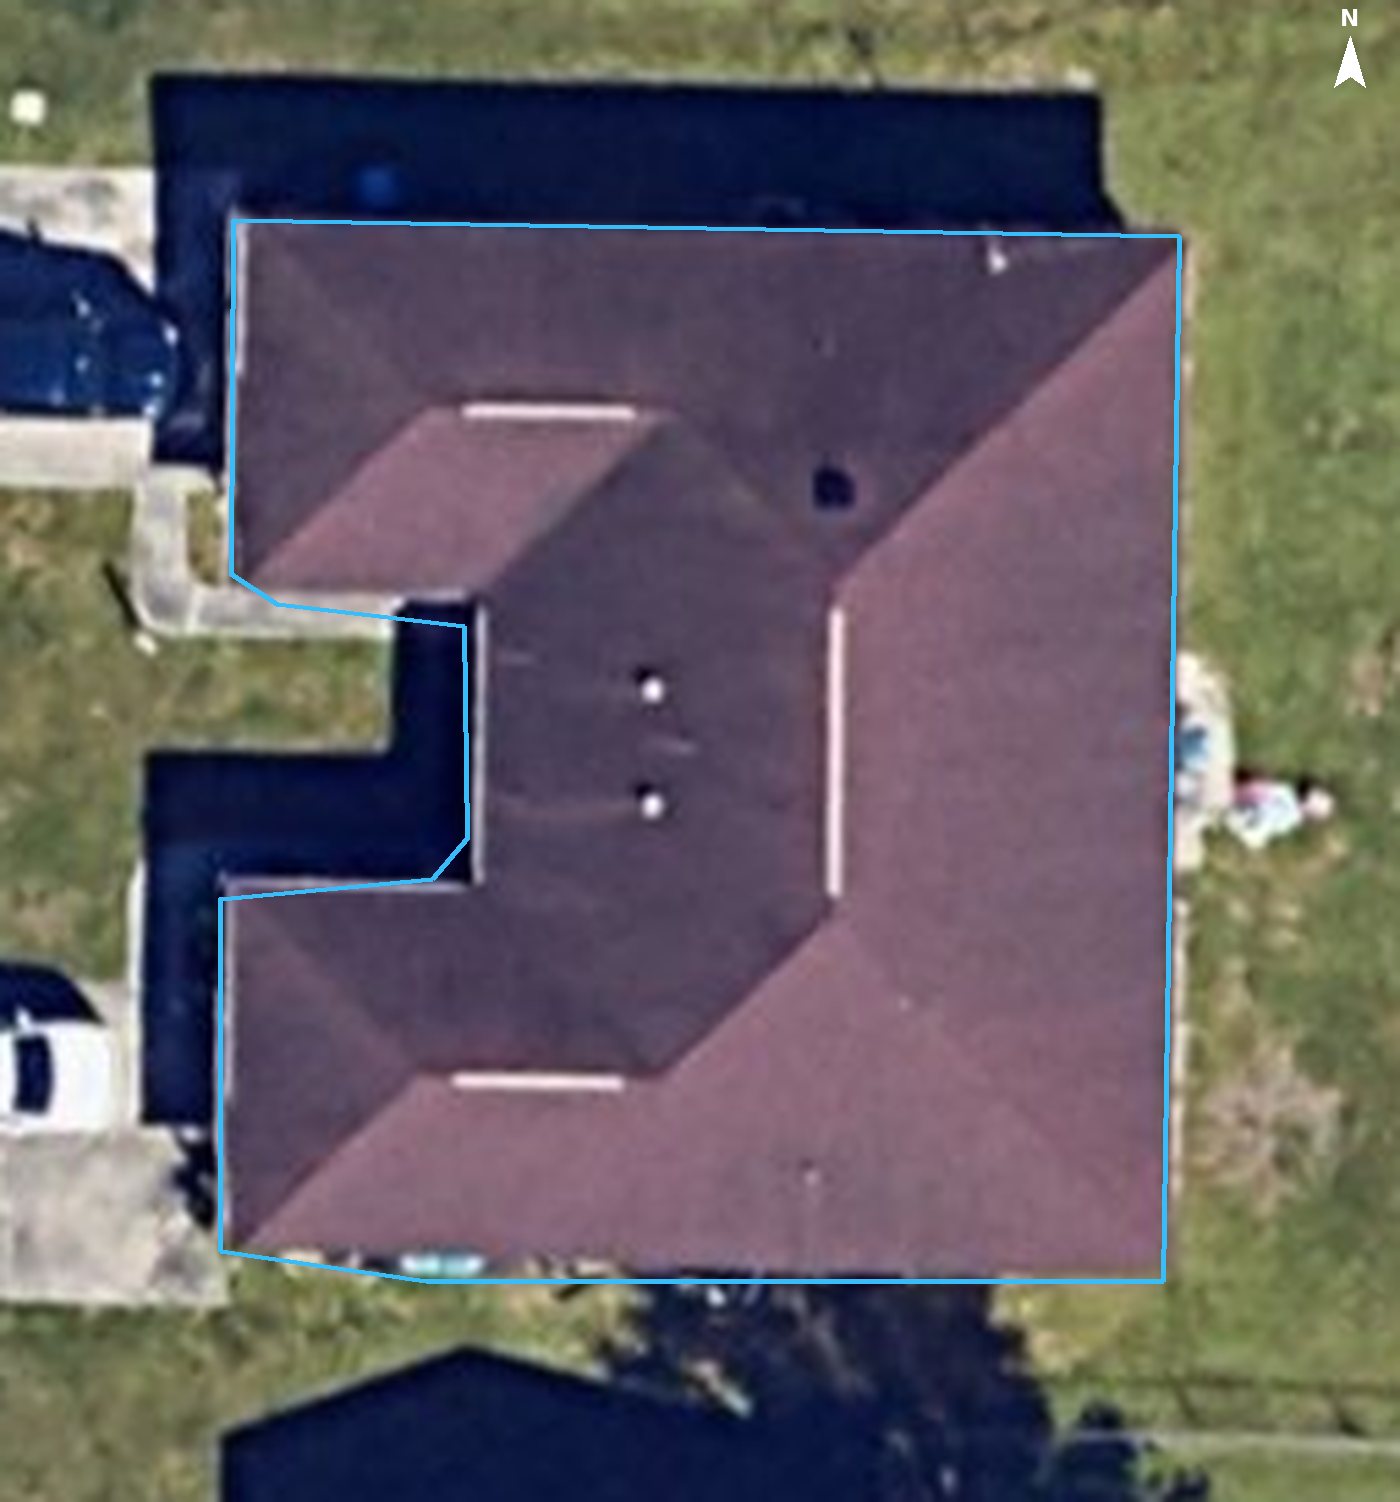
Roof planes
Each plane is numbered from largest to smallest. The label next to each number is its pitch.
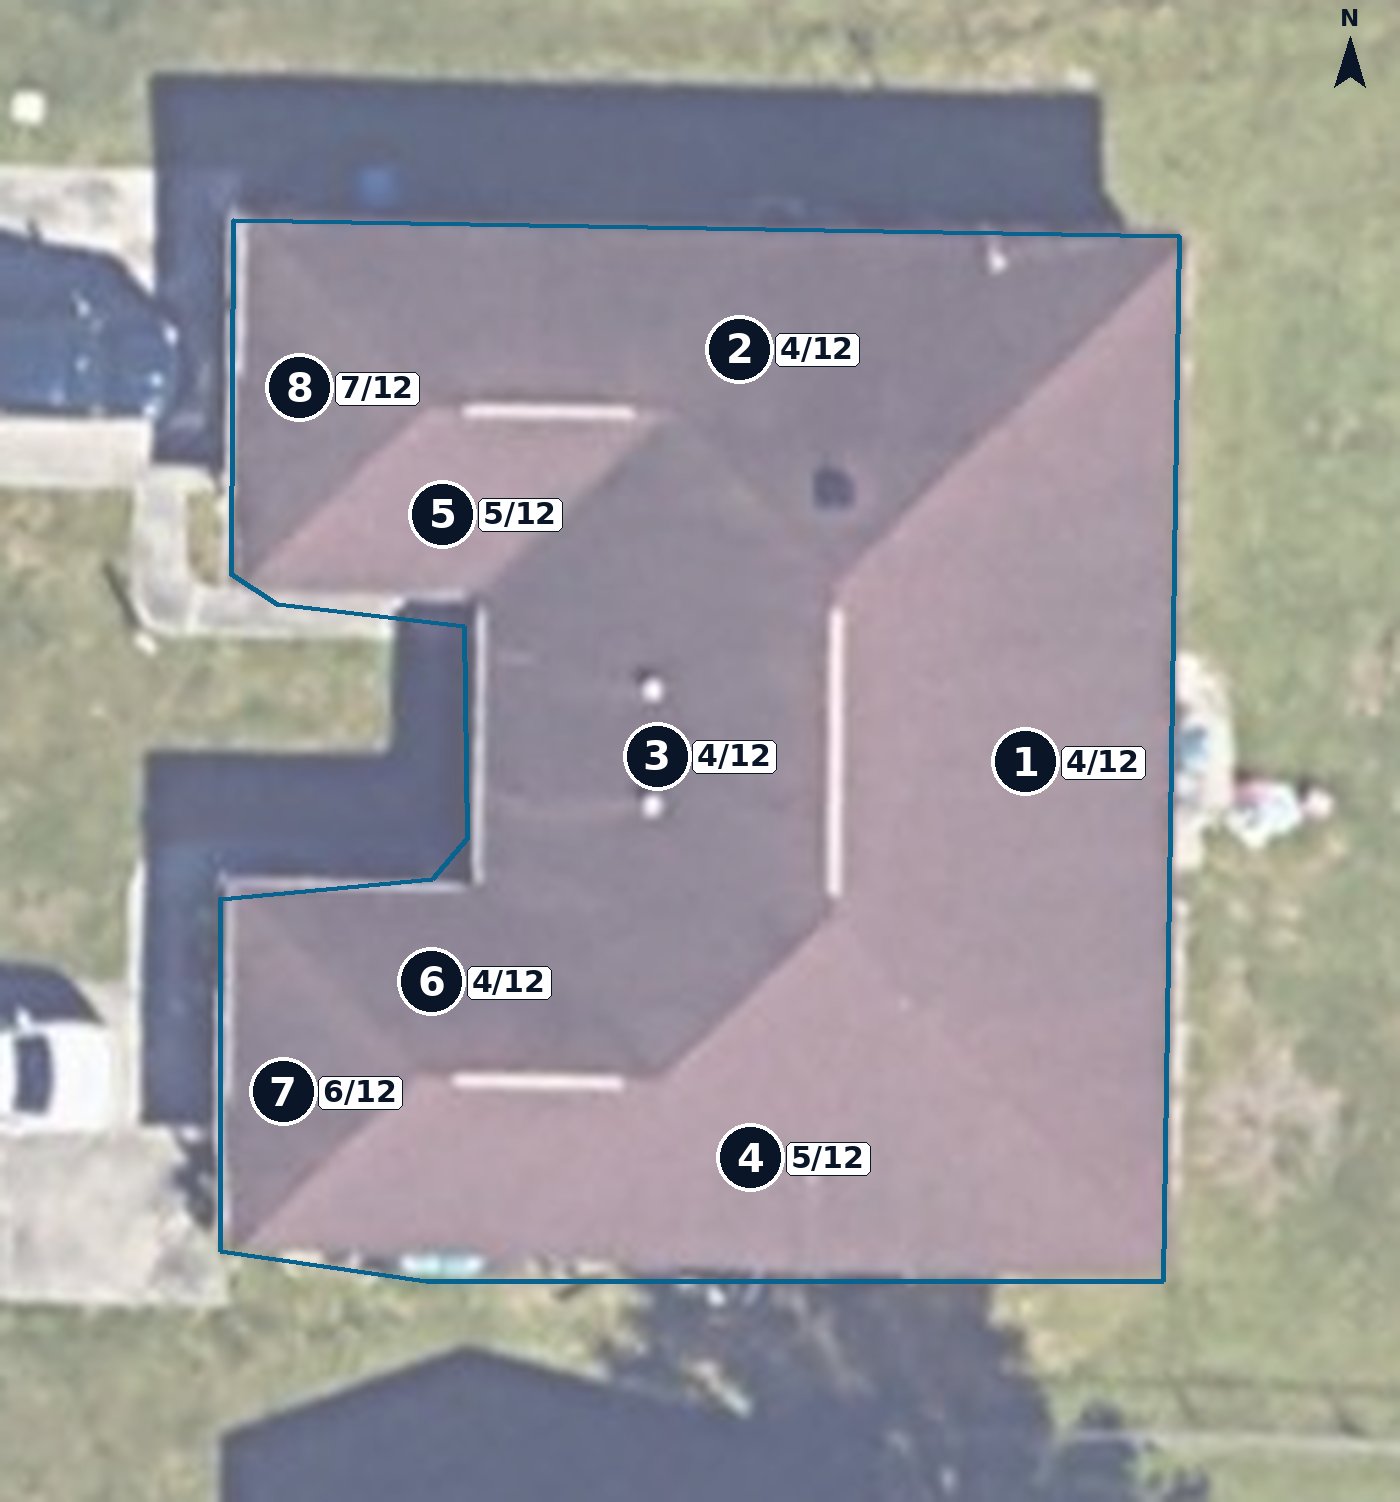
| # | Pitch | Angle | Faces | Area (sq ft) | Squares | Type |
|---|---|---|---|---|---|---|
| 1 | 4/12 | 19.7° | E | 778 | 7.8 | Walkable |
| 2 | 4/12 | 19.8° | N | 692 | 6.9 | Walkable |
| 3 | 4/12 | 18.7° | W | 688 | 6.9 | Walkable |
| 4 | 5/12 | 21.5° | S | 630 | 6.3 | Walkable |
| 5 | 5/12 | 20.7° | S | 193 | 1.9 | Walkable |
| 6 | 4/12 | 19.7° | N | 182 | 1.8 | Walkable |
| 7 | 6/12 | 26.3° | W | 163 | 1.6 | Walkable |
| 8 | 7/12 | 29.2° | W | 150 | 1.5 | Steep |
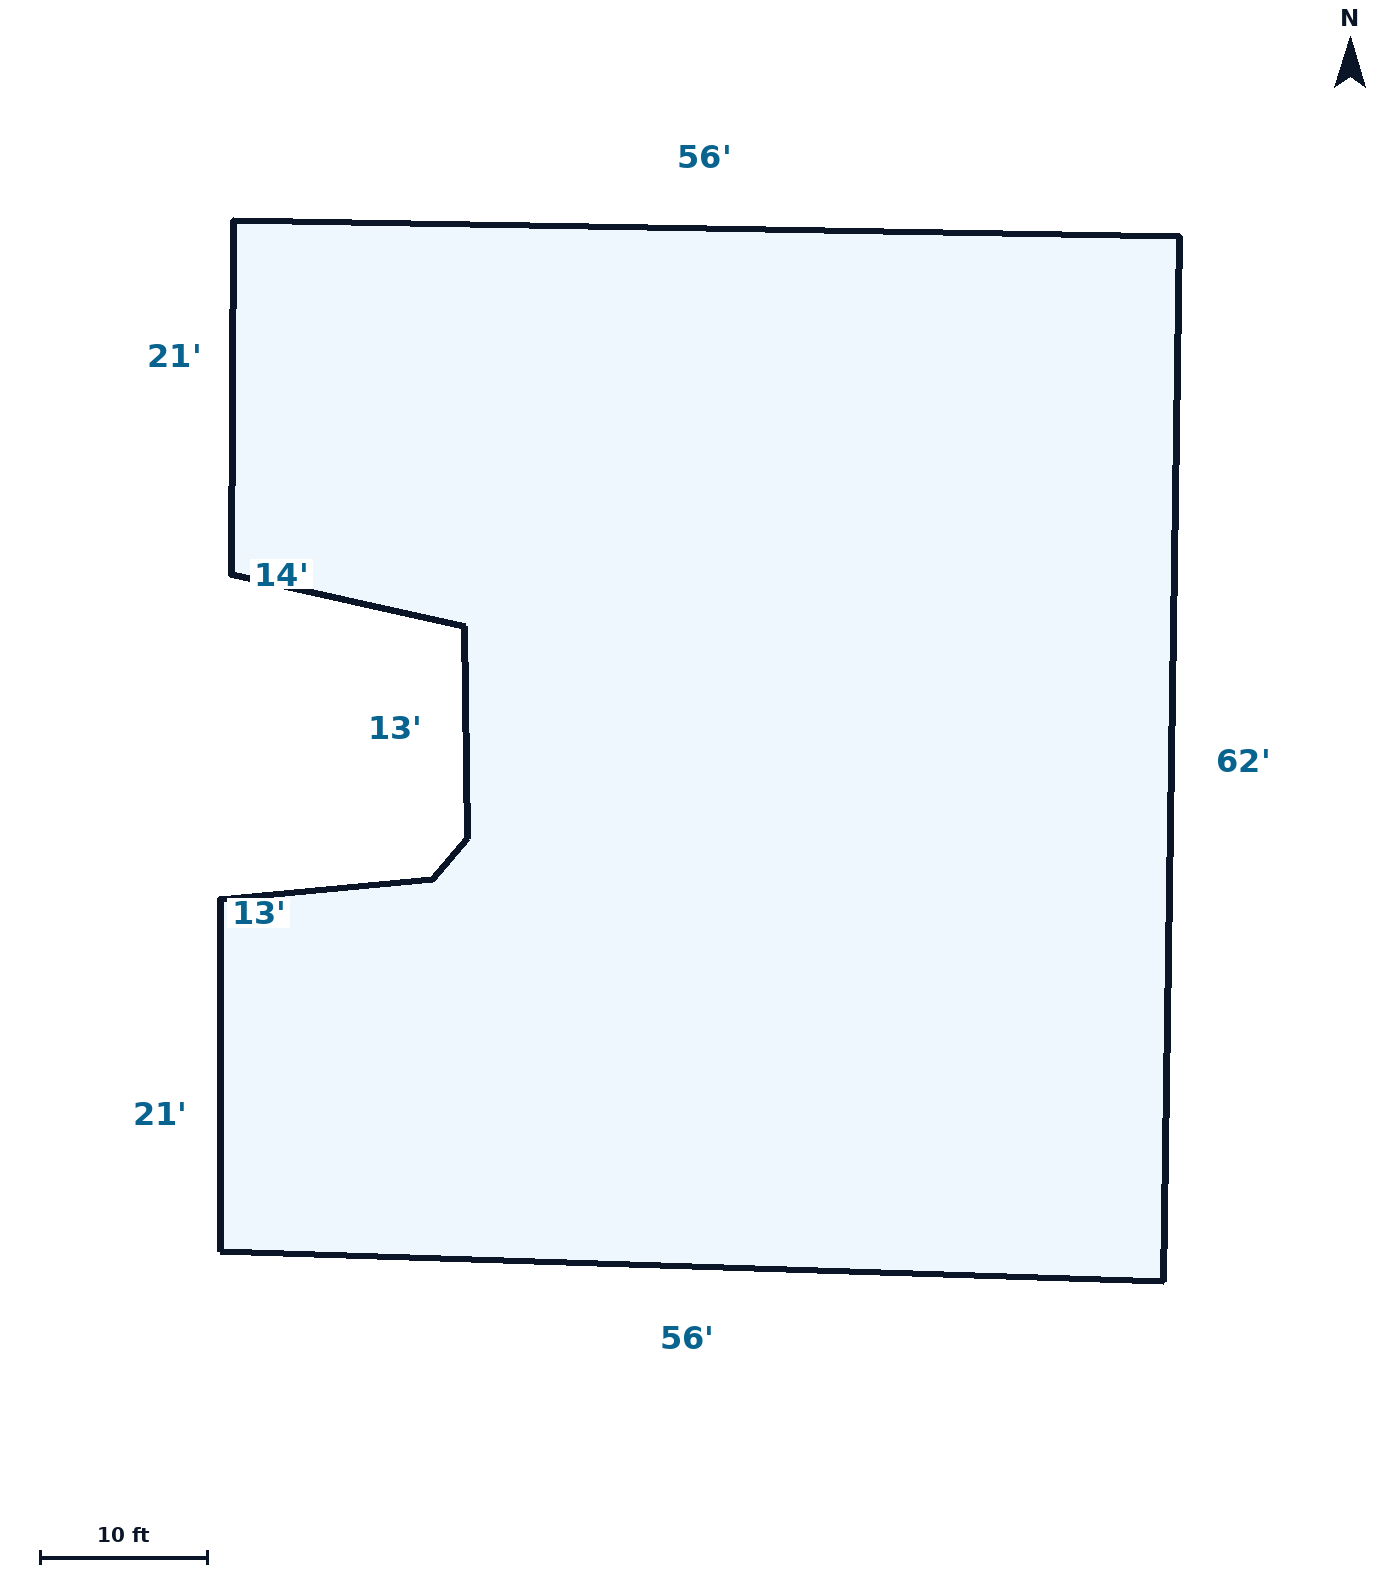
Roof outline & dimensions
Plan-view length of each outer roof edge. Measured outer edge: 268 ft · estimated eaves + rakes: ≈289 ft.
Waste factor table
Calculated on the shingle area (3,476 sq ft). Suggested waste for this roof: 11%, based on its 8 planes.
| Waste | Area (sq ft) | Squares | Shingle bundles | Underlayment rolls |
|---|---|---|---|---|
| 0% | 3,476 | 34.8 | 105 | 4 |
| 3% | 3,580 | 35.8 | 108 | 4 |
| 6% | 3,685 | 36.8 | 111 | 4 |
| 8% | 3,754 | 37.5 | 113 | 4 |
| 10% | 3,824 | 38.2 | 115 | 4 |
| 11% · suggested | 3,858 | 38.6 | 116 | 4 |
| 12% | 3,893 | 38.9 | 117 | 4 |
| 15% | 3,998 | 40 | 120 | 4 |
| 18% | 4,102 | 41 | 124 | 5 |
| 20% | 4,171 | 41.7 | 126 | 5 |
Material estimate at 11% waste
| Material | Basis | Quantity |
|---|---|---|
| Architectural / 3-tab shingles | 3 bundles per square | 116 bundles |
| Synthetic underlayment | 10 squares per roll | 4 rolls |
| Drip edge | Eaves + rakes ≈289 ft + 5% laps, 10 ft pieces | 31 pieces |
Approximate quantities for planning. Confirm coverage with your products’ specifications and local code. Starter strip, ridge cap, leak barrier and ventilation depend on edge types (eaves, ridges, hips, valleys), which instant reports do not include.
How this was measured. Horus measures each roof plane from high-resolution aerial imagery and a 3D surface model of the building. Areas are true sloped surface, overhangs included, plus a 1% allowance for small facets and edges that aerial models under-detect (calibrated against professional measurement reports). Imagery: High resolution (≈10 cm/pixel), captured November 5, 2023. Results are estimates for quoting and material planning; trees over the roof, changes after the imagery date and very complex roofs can affect accuracy. Verify critical dimensions on site before ordering materials. Not intended for insurance claims or legal surveys.
Source: Includes solar data from Google. Imagery © Google and its data providers. Report HR-XEK8AHOB · horusroofers.com